Notice: this Wiki will be going read only early in 2024 and edits will no longer be possible. Please see: https://gitlab.eclipse.org/eclipsefdn/helpdesk/-/wikis/Wiki-shutdown-plan for the plan.
Linux Tools Project/Systemtap/User Guide/graphing/graphingTutorial.html
Graphing Tutorial
In order to graph SystemTap scripts you must have a script open in the IDE Perspective, and the Run->Run w/ Chart option must be used. If you are unfamiliar with how to load or write a SystemTap script, please review the IDE Tutorial in the SystemTap IDE User's Guide. Please use the following script for this example by copying and pasting it into a new file (any name is fine that ends in a .stp extension):
global read, write, start

probe begin {
   start = gettimeofday_s()
}
probe syscall.write {
   write += count
}

probe syscall.read {
   read += count
}

probe timer.ms(1000) {
   printf("%d\t%d\t%d\n", (gettimeofday_s()-start), read, write)
   read=0
   write=0
}
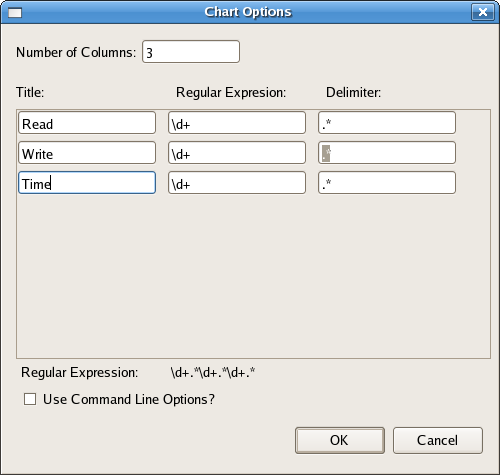
Now select Run->Run w/ Chart. This feature will prompt the user for the number of columns for the chart, in addition to their titles and regular expressions. The regular expressions are used to parse the console output for the script and determine the values of each column at a certain sample point. The combined regular expression is shown at the bottom of the dialogue box. You should see the following:
For this example enter the following:
	Columns: 3

	TITLE	REGULAR EXPRESSION	DELIMITER
	Time		\d+		.*			\D+
	Read		\d+		.*			\D+
	Write		\d+		.*			\D+
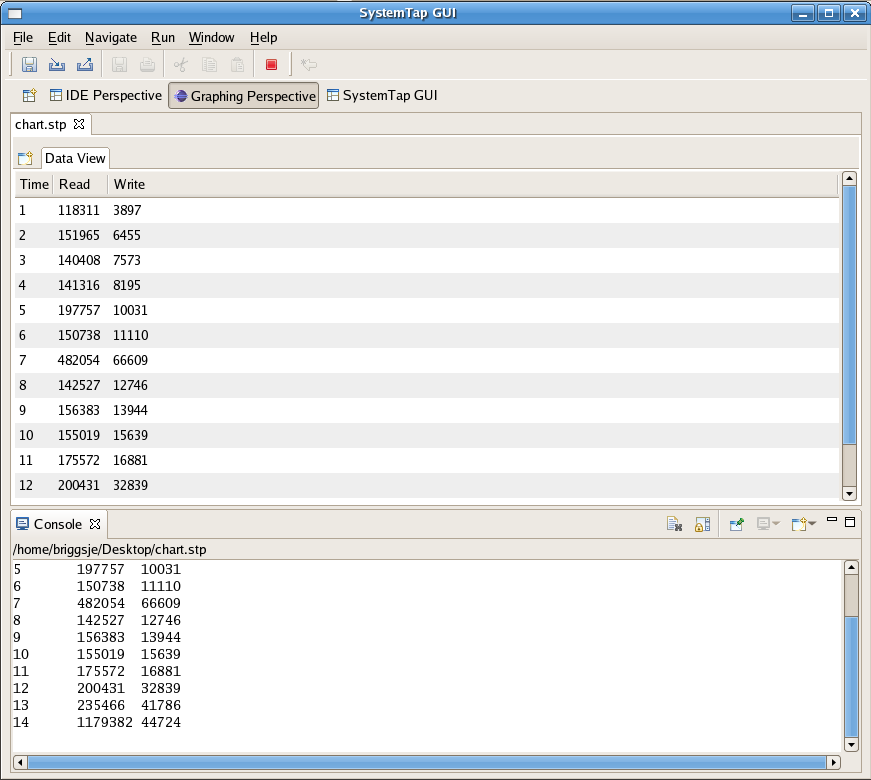
The title fields simply display the associated string in the column's header. After clicking OK the script will prompt you for details regarding the Remote Server. Provide the ip address of the remote server that is running the systemtapgui Server or the Data Management Daemon. The port is by default 22462. Enter a username and password.This will give the application permissions to run your script on the remote machine. You have the option of saving your password as well, however be warned this is currently NOT encrypted so this convenience runs at a risk. The username is also used to transfer the file to the remote system using SCP. If the same machine is used as both the server and the client enter 'localhost' for the Host field. When the script is executed the application will switch into the Graphing perspective. A Data View chart is populated with live data, in addition to the output in the console.
You should see a screen similar to the following:
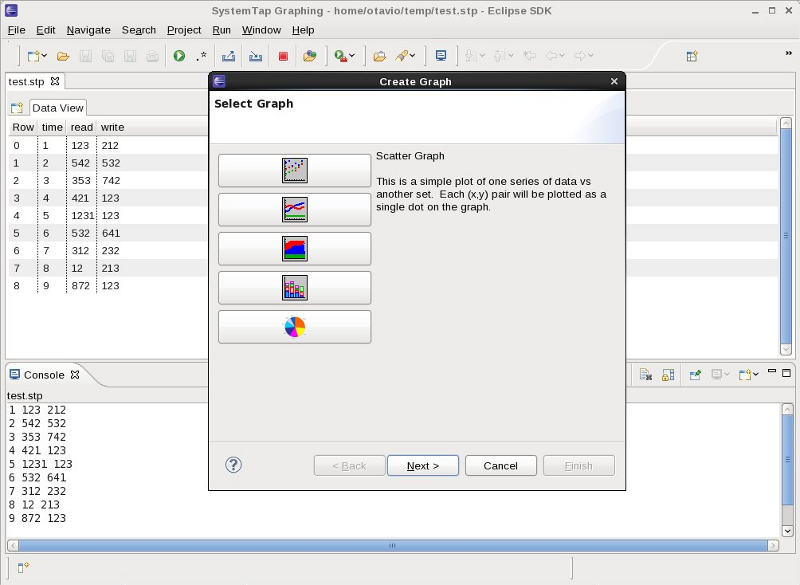
You will see that the data table poplulates from live data parsed from the console. Now we'll make a graph to briefly illustrate the Graphing perspective. Click the Create Graph button next to bring up the Select Chart dialogue.
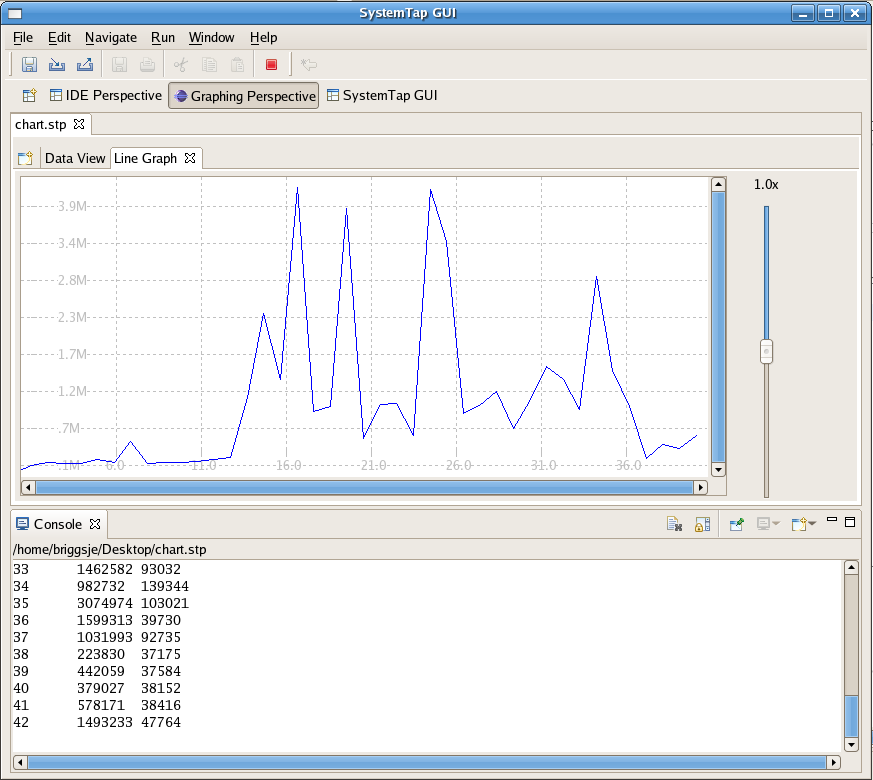
Select line graph. You will be prompted to select a column of the X series and Y series; select "Time" and "Write" respectively. After you click ok you should see the line graph as follows:
Note that the multiple series graphs (Multi-Line, Multi-Bar, and Multi-Scatter) will request two Y series, Y1 and Y2. In the case of our example, these would be "Read" and "Write". Each series will be assigned a different color value for the purposes of differentiation and will be plotted both in respect to the specified X series.


